
Website analytics
help us help you
We are not a lazy team. We just have a lot to do. (You've heard that before, maybe? But this time it's convincing, maybe?) We are asking you -- developers, statisticians, data scientists -- to help make the Global Forest Watch site better.
Global Forest Watch launched on February 20, 2014 to much fanfare. Even Jane Goodall herself participated in the launch with a video address. Since then, to date, the site has seen 404,207 visits from 340,347 unique visitors. Every country on the planet is represented in this visitor count. This is a record for WRI.
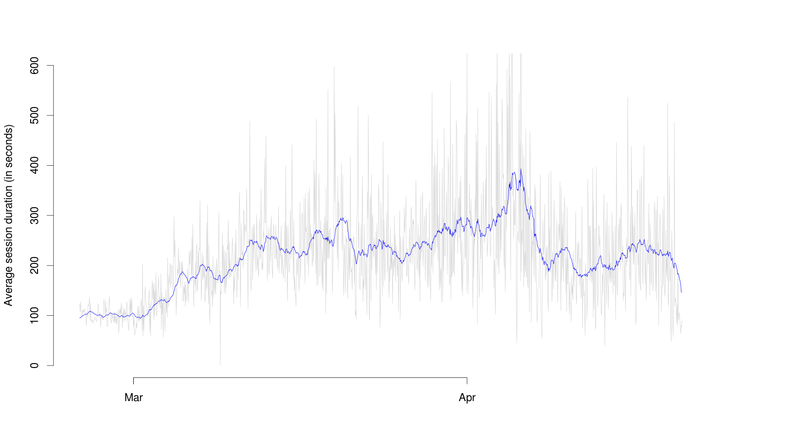
The site provides a wealth of information, including global assessments of annual deforestation and near real-time updates on tropical forest cover loss. Users can upload stories from the field. Policy makers can analyze deforestation within specific areas. There are country level break-downs of forest cover loss, with contextual socioeconomic information. Here is a quick graph, average time spent on the site by hour (grey) and a 24-hour moving average (blue):
So, listen. We want to make the site better, more responsive to user needs. We are not user experience designers; and we don't have a big marketing budget. We do, however, have a lot of information on how the site is being used. We have uploaded a bunch of this on site usage (below), pulled from Google Analytics. We want to know where users are exiting the site and why. We want to experiment with fixes. Here is a description of the Google Analytics dimensions and metrics. And we want your help. Please, download the information, find patterns -- and then maybe tell us about it. If you have any questions or requests for additional data, you can either post in the comments section or send us an e-mail at datalab@wri.org. Thanks.
Dimensions: year, month, day, user type, source, browser
Metrics: users, bounces, session duration, page views, unique page views
split-a.csv (3.2MB)
Dimensions: year, month, day, country, language, search used
Metrics: users, bounces, session duration, page views, unique page views
split-b.csv (1.9MB)
Dimensions: year, month, day, page depth, hostname, days since last visit
Metrics: users, bounces, average session duration, exits
split-c.csv (0.6MB)